Reports: find the number, share the view
Reports, in the Manage section of the sidebar, is one place to answer the questions an owner actually asks: who owes us money, are we booking enough, where is the pipeline, are we hitting our hours. It is a gallery of reports organized into three groups, Money, Sales & pipeline, and Operations, and every report is a link you can paste to a teammate that opens the exact view you were looking at.
This page explains how to find your way around and what each report is for. The reading guides go deeper on each group.
Find the right report
Reports has two views. The gallery, reached with All reports, lays every report out as a card with a one-line description, grouped under Money, Sales & pipeline, and Operations. Pick a card to open that report. Once you are in a report, the left-hand rail keeps the same groups so you can jump between them, and Filter reports at the top of the rail is a type-to-find box.
Two small conveniences: click a report’s star to pin it, and pinned reports gather in a Pinned group at the top on every device you sign in from. Reports opens to in the header lets you choose whether Reports reopens the gallery or My last report.
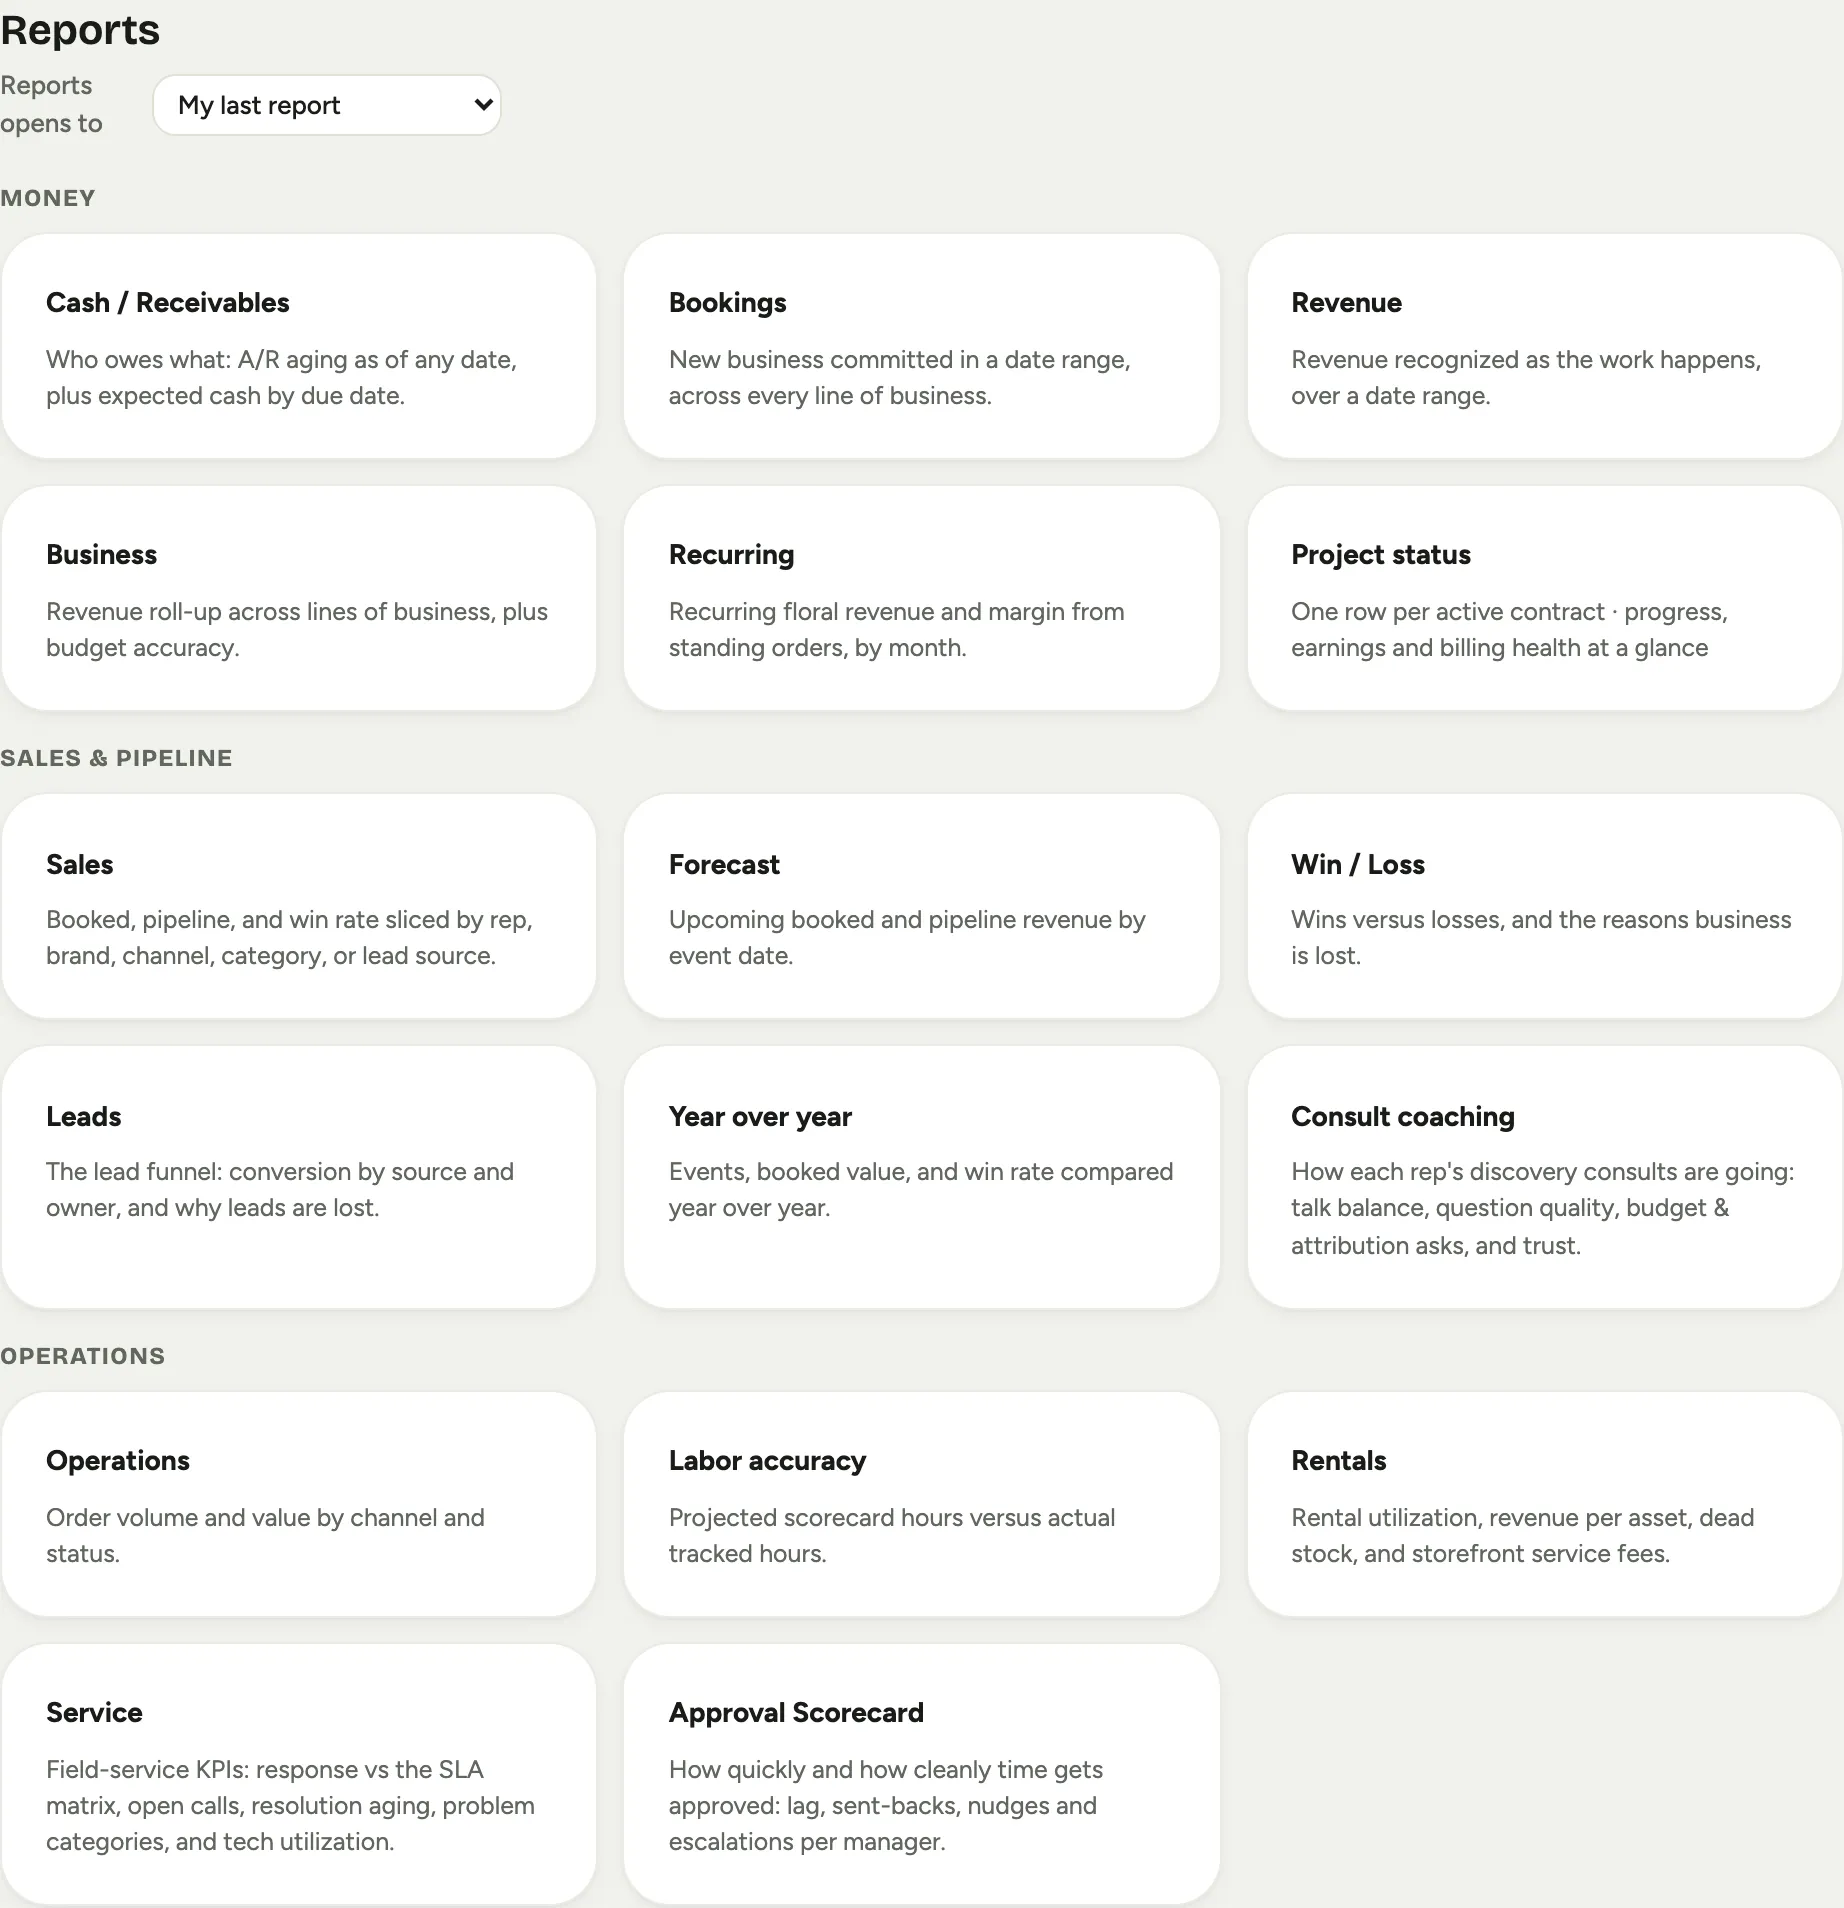 Screenshot from a demo workspace; data illustrative.
The shared controls
Most reports share the same controls, and every control you change is written into the web address, which is what makes the link shareable:
- Period pills, Week, Month, Quarter, Year, on the reports that trend over time.
- A date range, From and To, on Bookings and Revenue.
- As of on Cash / Receivables, so you can age the book to any date, and Show from QuickBooks to fold in your accountant’s open items.
- Copy link to put the current view on your clipboard, and Print / PDF to print it.
- Export CSV to pull a report’s table into a spreadsheet.
Sharing and exporting have their own guides: Share a report and Export a report to a spreadsheet.
The money reports
The Money group is cash and revenue:
- Cash / Receivables: who owes what, aged as of any date, plus expected cash by when it is due.
- Bookings: new business committed in a date range, across every line of business.
- Revenue: the same value recognized by when the work actually happens.
- Business: a revenue roll-up across lines of business, with budget-accuracy.
- Recurring: recurring floral revenue and margin from standing orders.
The sales and pipeline reports
The Sales & pipeline group is where deals come from and where they go:
- Sales: booked value, win rate, and pipeline sliced by a dimension you choose.
- Forecast: upcoming booked versus pipeline revenue by event date.
- Win / Loss: won versus lost, and why the losses happened.
- Leads: the lead funnel, conversion by source and by owner.
- Year over year: this year against last across the headline numbers.
- Consult coaching: per-rep discovery-consult quality, for managers.
See Read the sales and pipeline reports.
The operations reports
The Operations group is how the work runs:
- Operations: order volume and value by channel and status.
- Labor accuracy: projected scorecard hours versus actual tracked hours.
- Rentals: utilization and revenue per asset, plus storefront service fees.
- Service: field-service response and resolution against SLA, for service-enabled studios.
- Approval Scorecard: how quickly and cleanly time gets approved.