Read the operations reports
The Operations group is the how-the-work-runs view: order flow, whether your hours estimates hold, how your rental fleet earns, and how the team keeps its promises.
Operations
Operations is order volume and value by channel and by status, with drill-through to the order lists behind each bar. It is the pulse of your day-to-day orders.
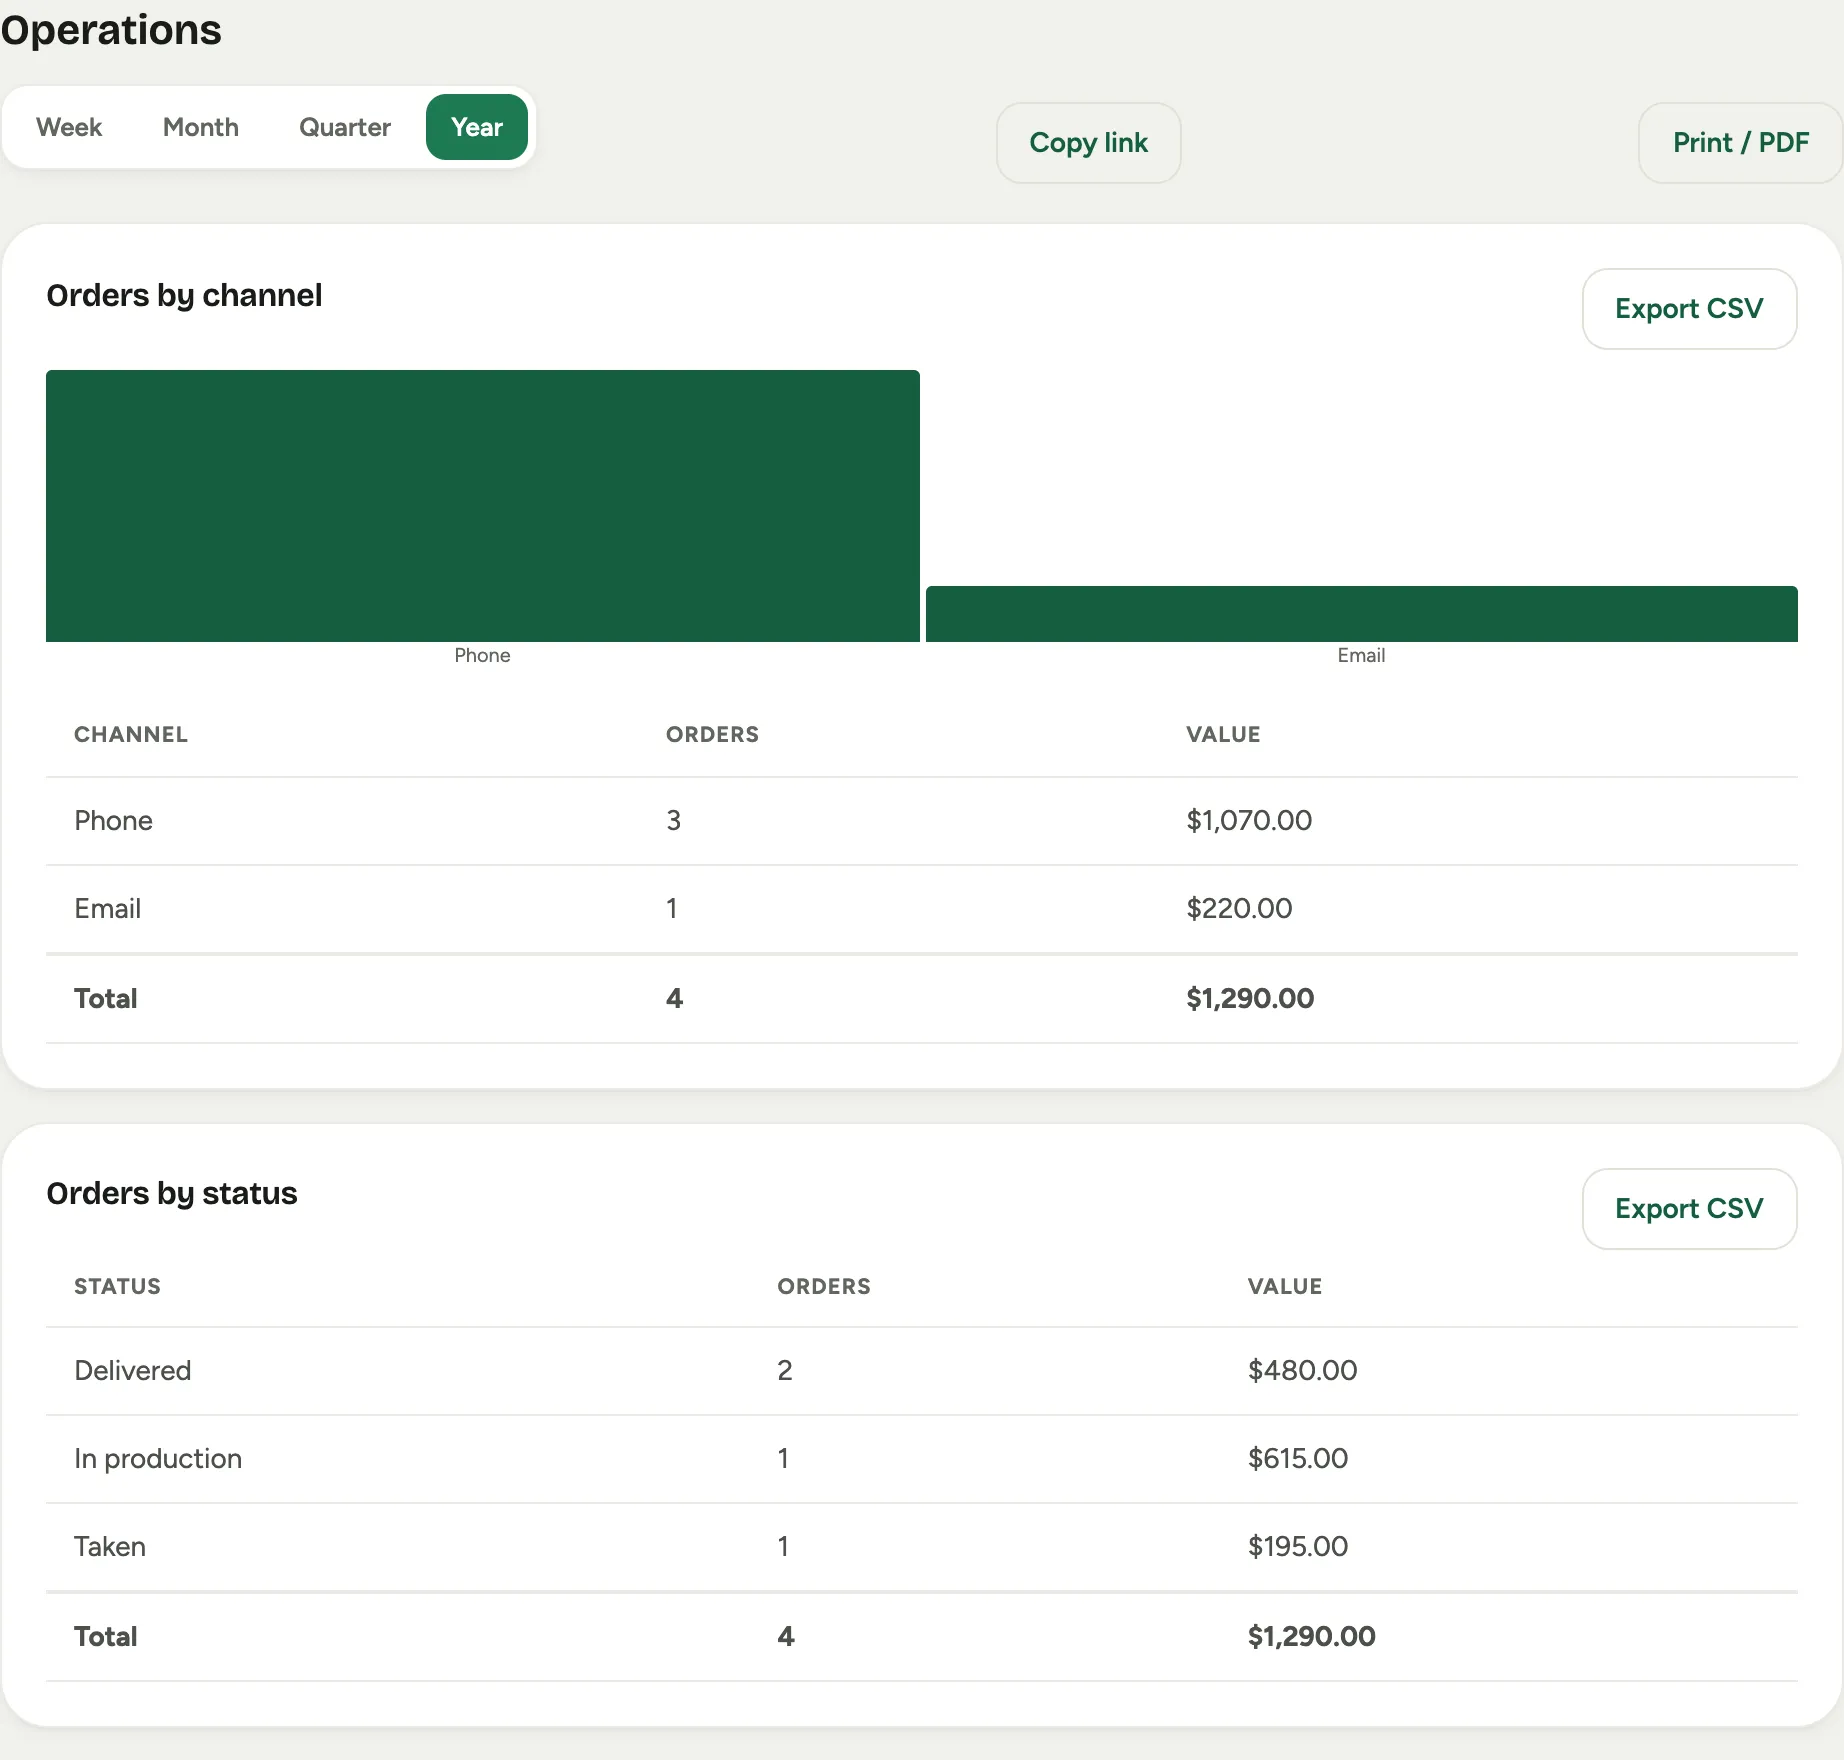 Screenshot from a demo workspace; data illustrative.
Labor accuracy
Labor accuracy compares the hours your scorecard projected against the hours actually tracked, as a variance by event type and per event. It is how you learn that ceremony installs always run long, and price the next one right. It needs both a projection and logged actual time on an event to have something to compare.
Rentals
Rentals is utilization and revenue per asset, your dead stock, and a storefront service-fees section. It answers which pieces earn their keep and which are sitting in the warehouse.
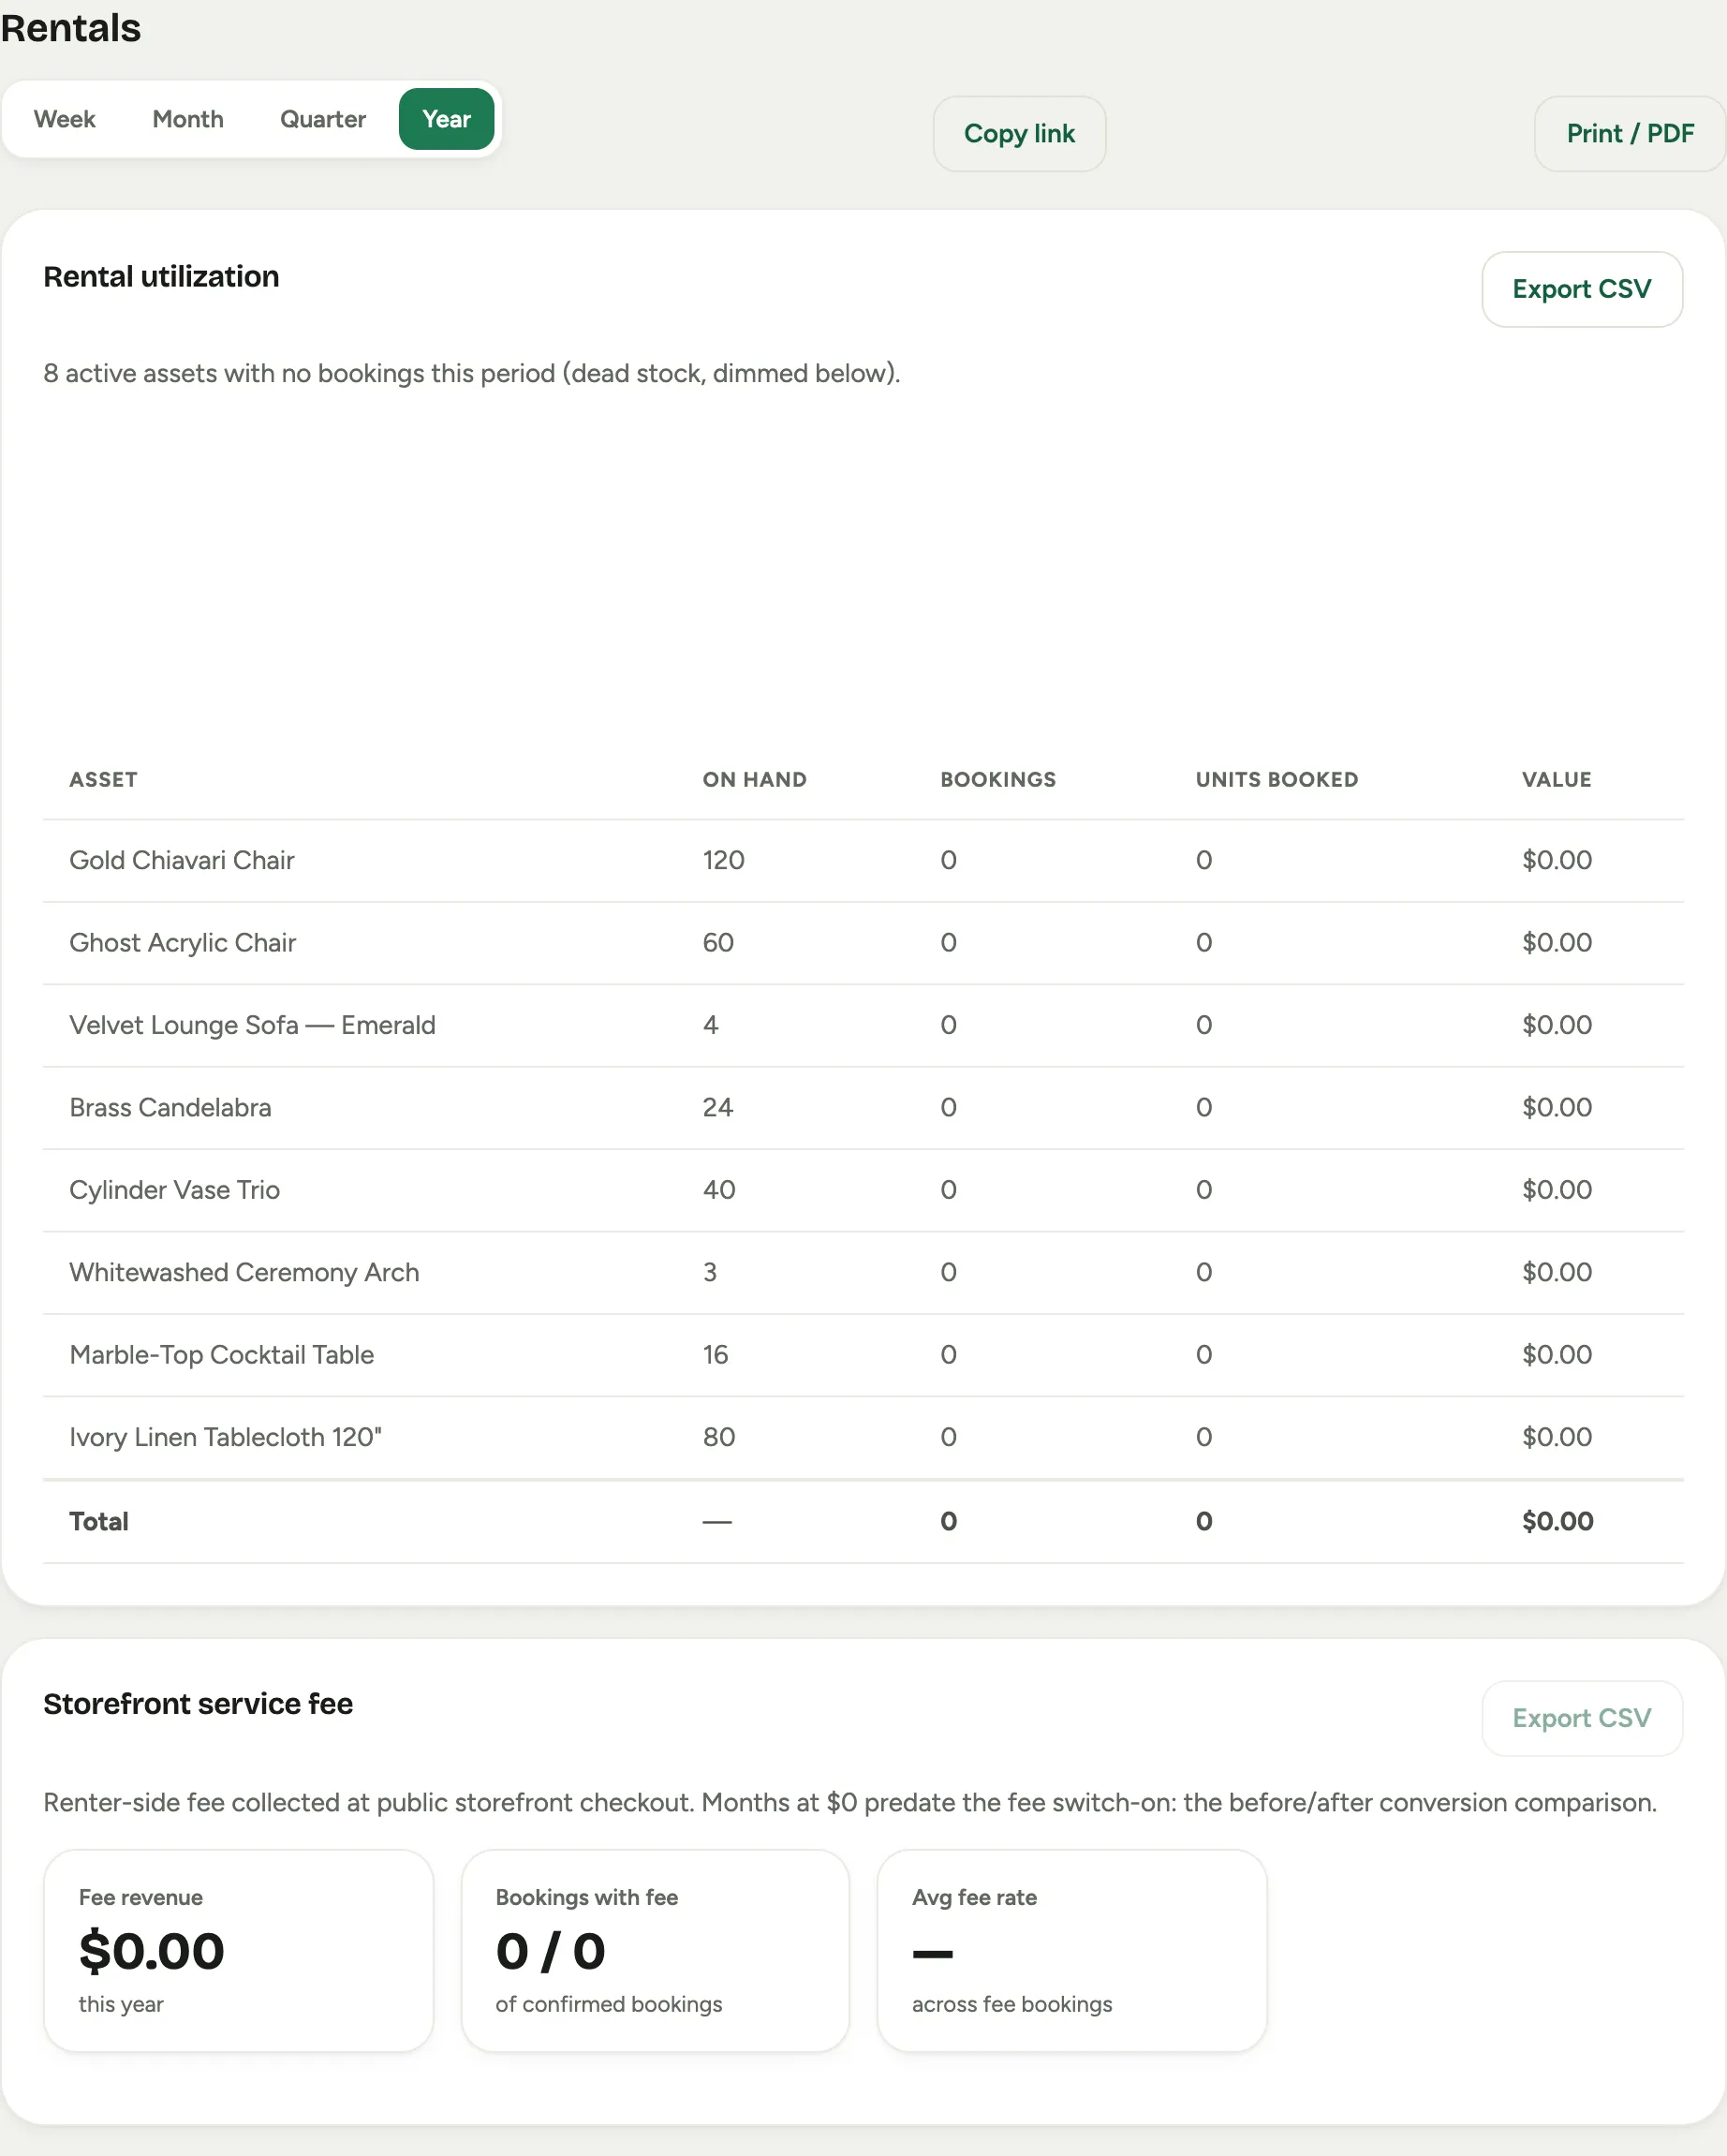 Screenshot from a demo workspace; data illustrative.
Service
Service is the field-service scoreboard for studios on that add-on: first response against SLA, resolved-within rates, what is at risk, opened versus closed, aging, problem categories, and tech utilization. It appears only when Field Service is enabled.
Approval Scorecard
Approval Scorecard measures how quickly and cleanly time gets approved: median lag, within-one-business-day rate, send-backs, nudges, and a ranked table across managers. It keeps payroll honest and timely.
Good to know
- Labor accuracy and Approval Scorecard are thin until there is history to measure: hours logged and compared, time submitted and approved. They fill in as the studio runs.
- Service is hidden entirely unless your studio has the Field Service add-on.