Read the sales and pipeline reports
The Sales & pipeline group tells you where business comes from, what is coming, and why you win or lose. Most of these trend over time with the Period pills.
Sales
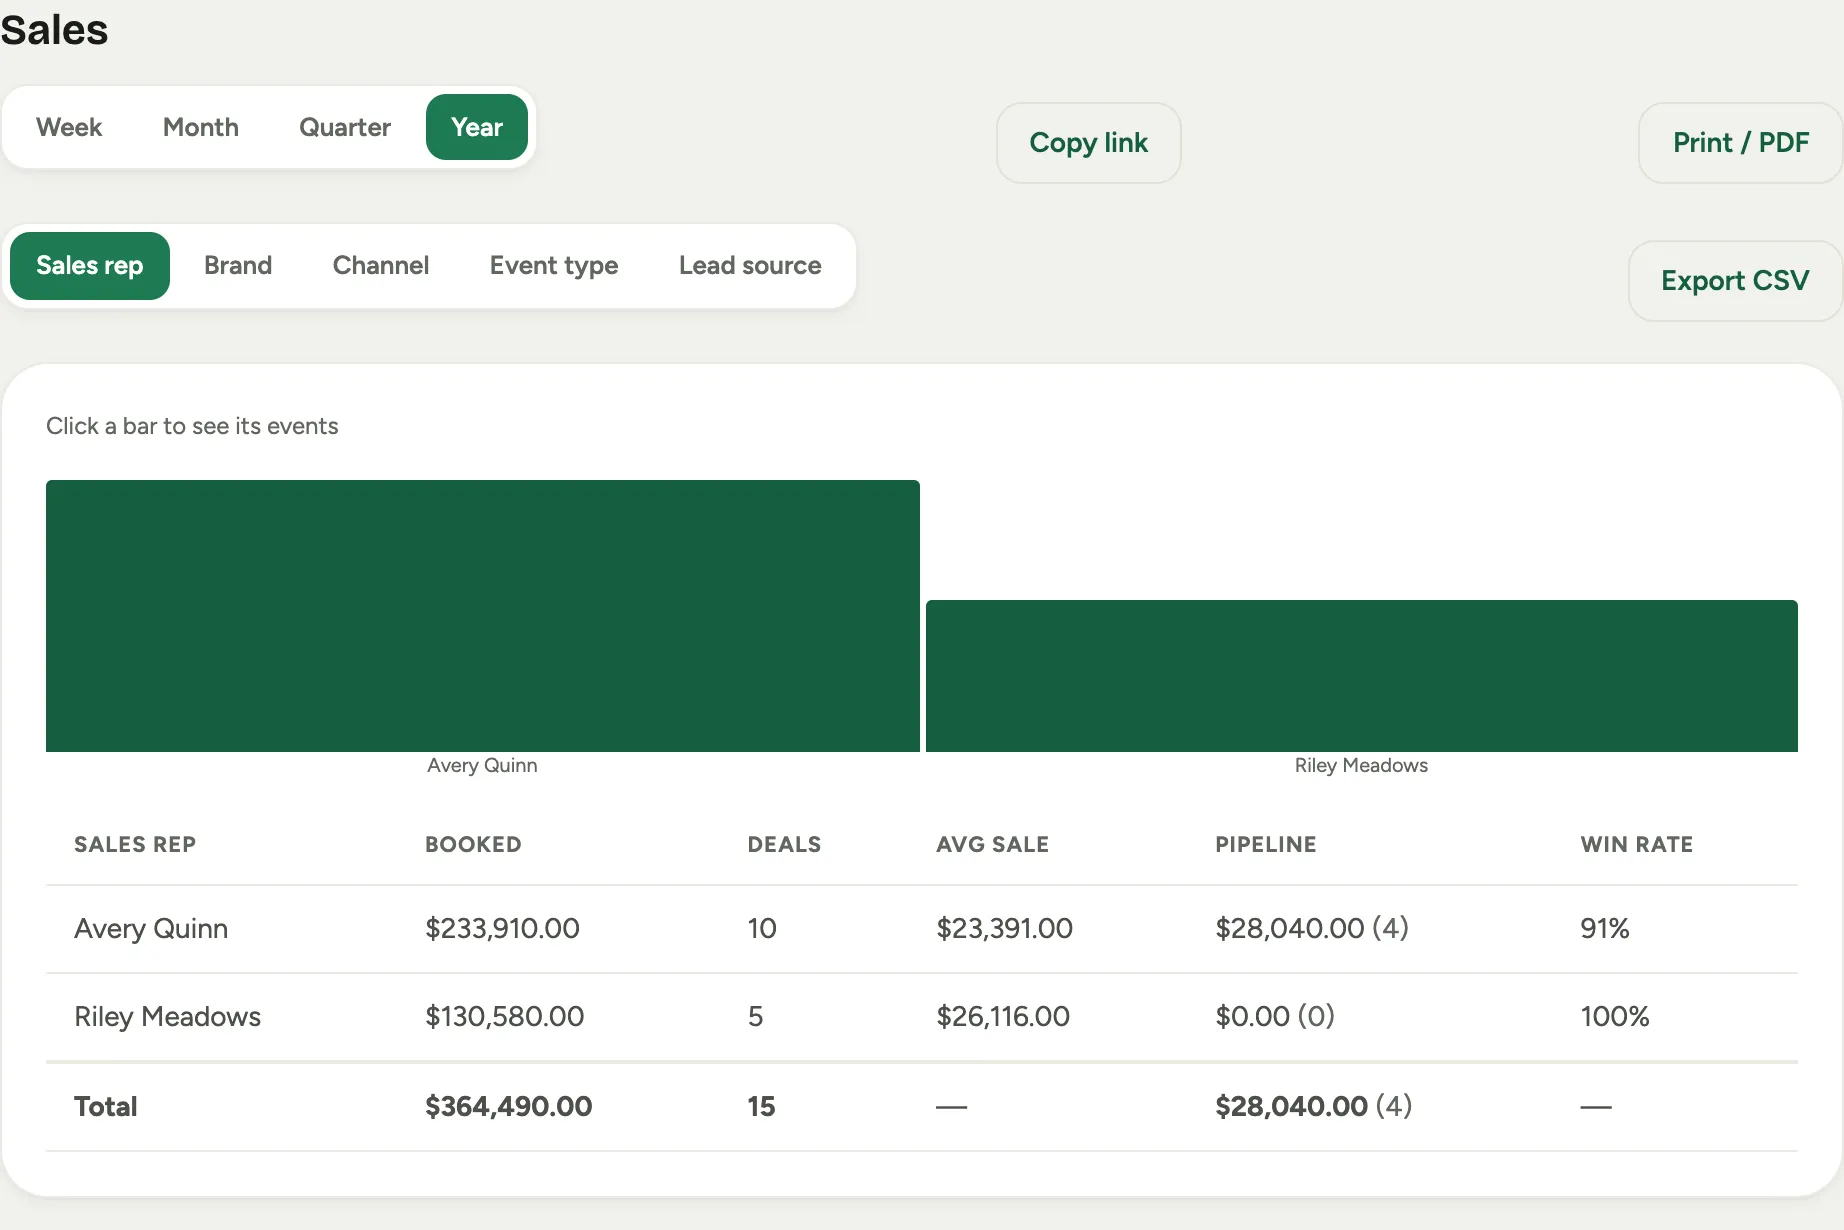
Sales is your booked value, deal count, average sale, pipeline, and win rate, sliced by a dimension you pick: Sales rep, Brand, Channel, Event type, or Lead source. The bar chart and table drill through to the underlying booked and pipeline events, so a number you do not believe is one click from the deals behind it.
 Screenshot from a demo workspace; data illustrative.
Forecast
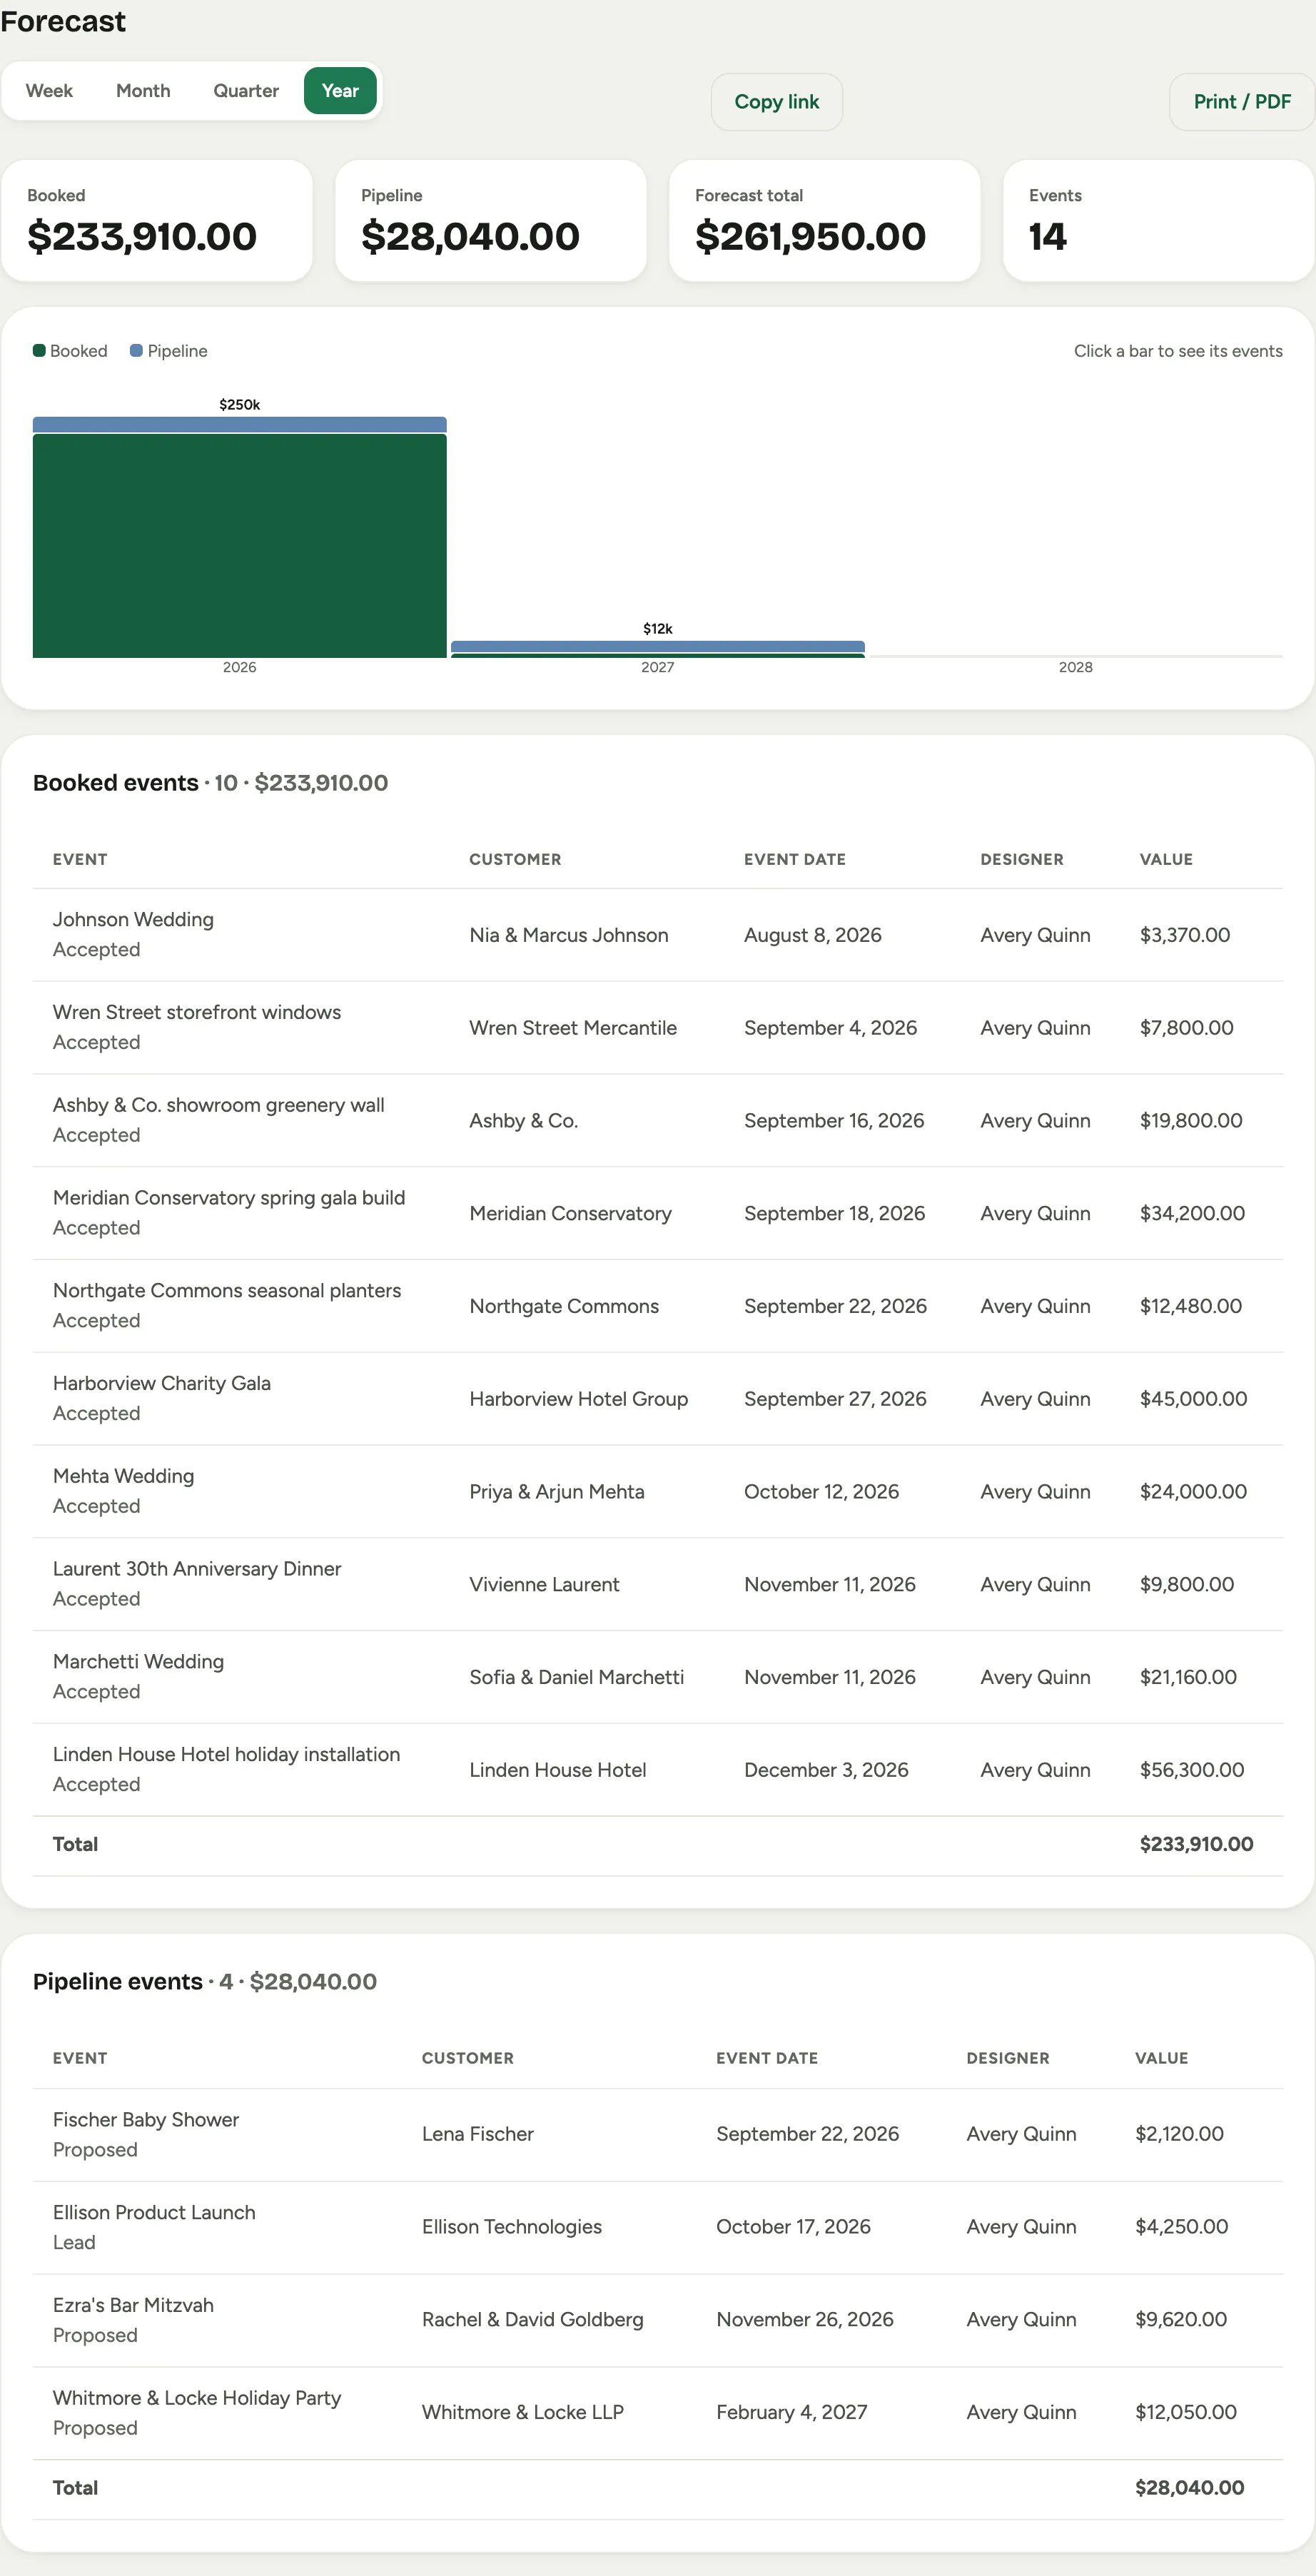
Forecast buckets upcoming revenue by event date and splits it into booked versus pipeline, so you can see what is committed and what is still hopeful in the months ahead. Drill a bar to the events in it.
 Screenshot from a demo workspace; data illustrative.
Win / Loss
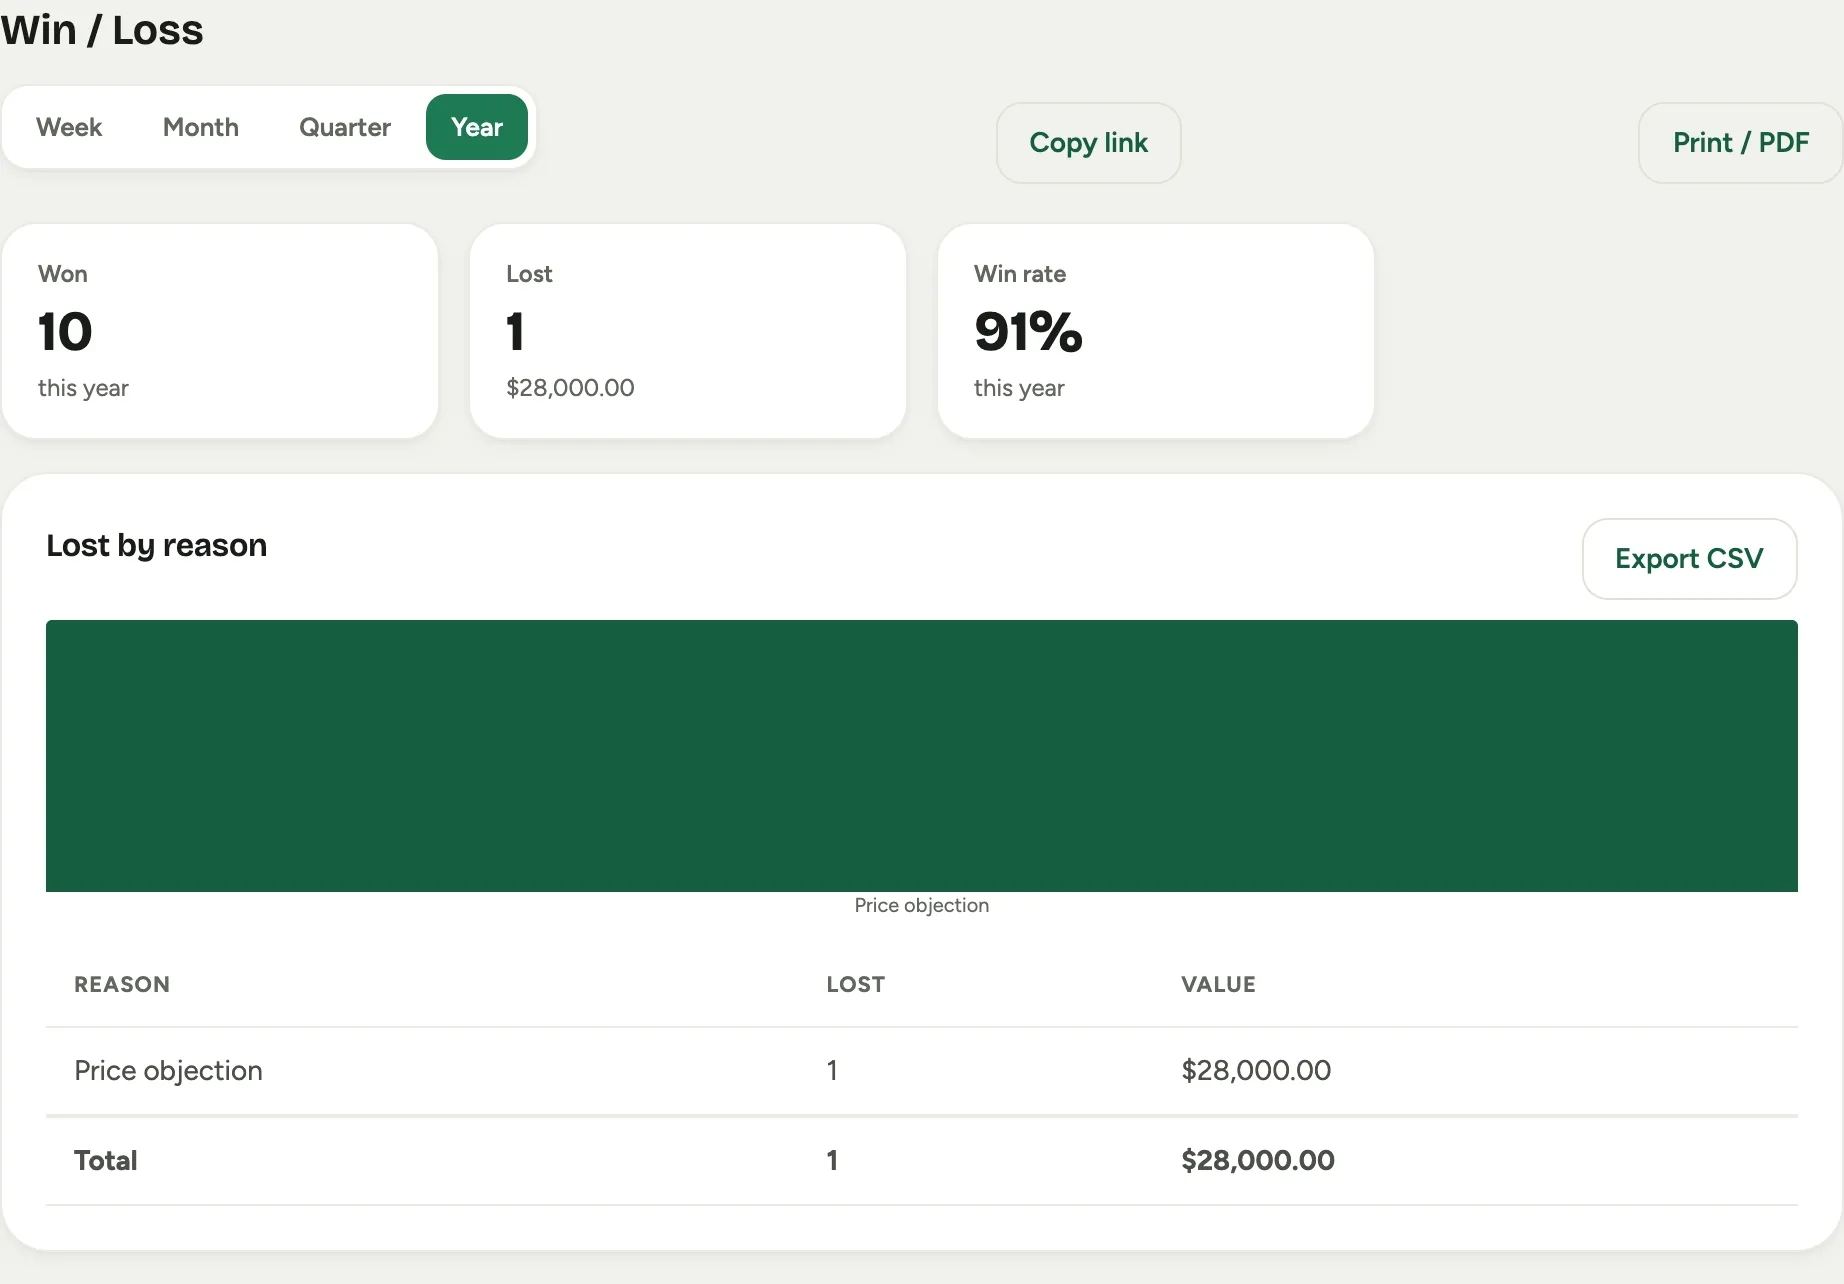
Win / Loss is won versus lost counts and your win rate, plus the value you lost broken out by loss reason. It is the report that turns “we lost a few” into “we lost four to budget and two to timing,” which is something you can act on.
 Screenshot from a demo workspace; data illustrative.
Leads
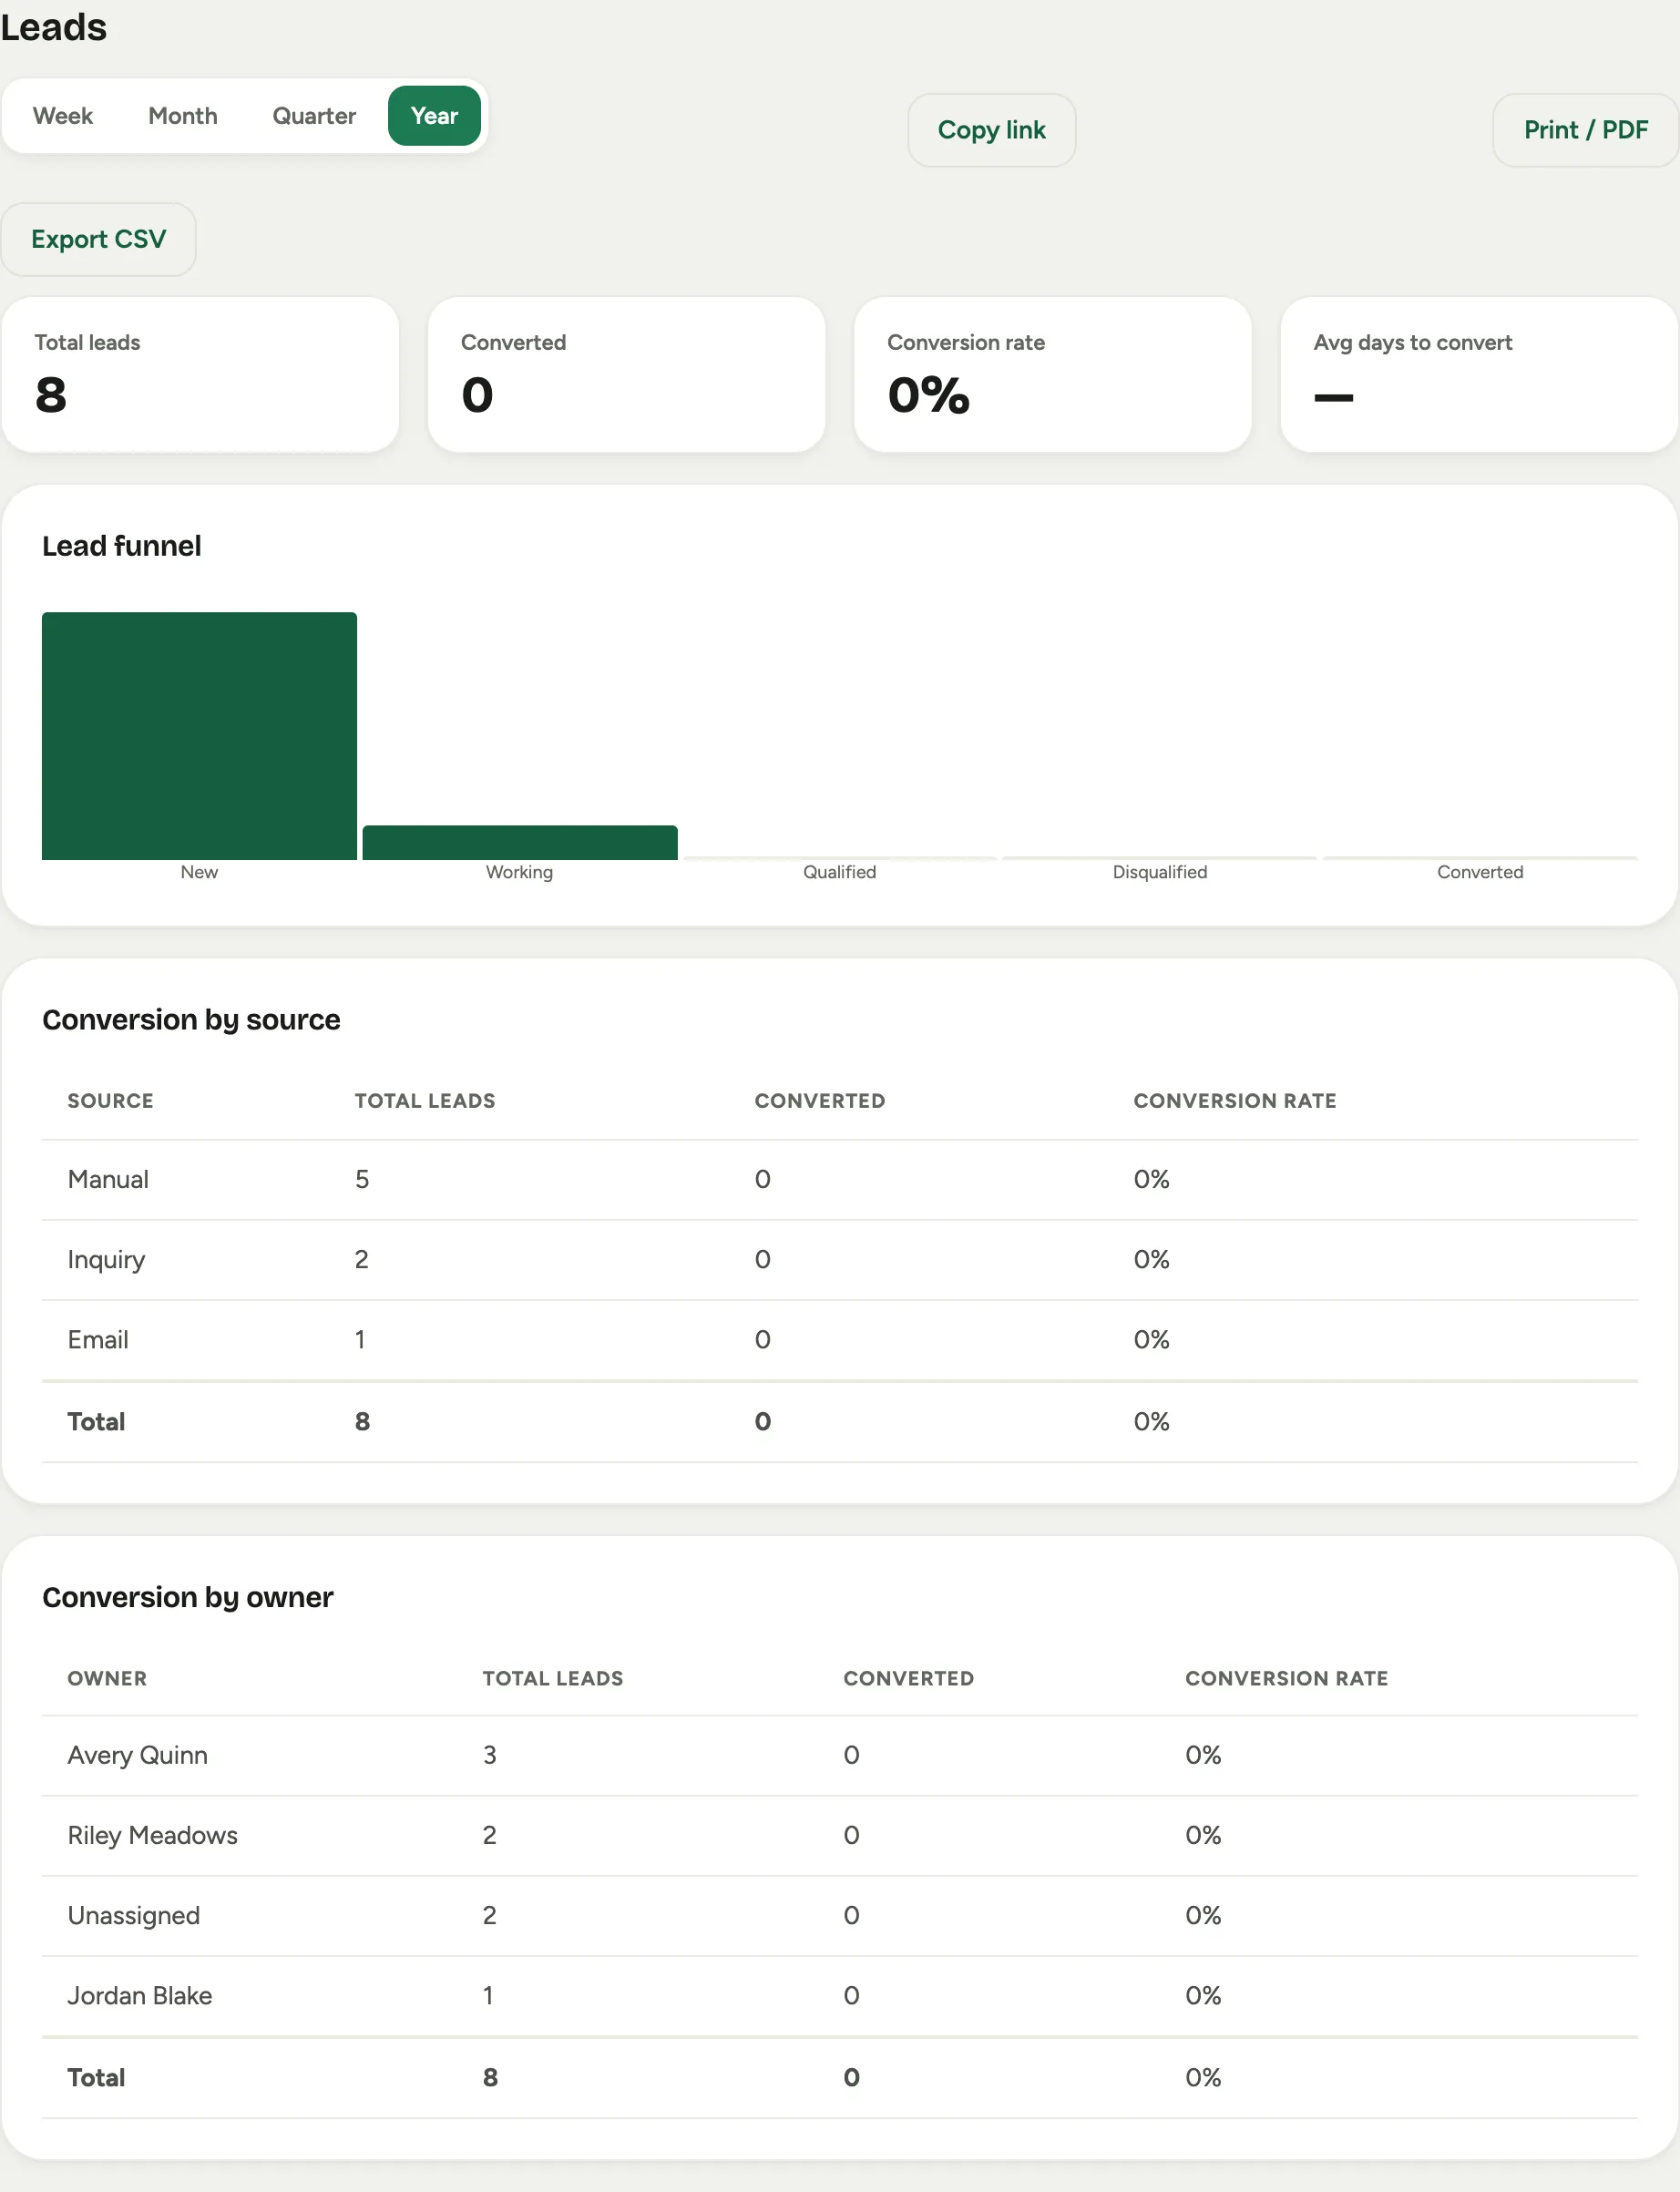
Leads is the top of the funnel: totals, conversion rate, average days to convert, and conversion broken down by source and by owner, plus a disqualified-by-reason view. Read it with Leads and customers to see where to spend your marketing.
 Screenshot from a demo workspace; data illustrative.
Year over year
Year over year compares this year against last across the headline numbers, events, booked count and value, average sale, lost, and win rate, by event year. There is no period selector; it is the annual scoreboard.
Consult coaching
Consult coaching is a manager view of discovery-consult quality per rep: how much the client talked, how many questions were asked, whether budget came up front, and a trust score. It turns the sales conversation into something you can coach.
Good to know
- Sales is the only report with the dimension selector; the rest trend by period or by year.
- These reports read whatever your team has captured, so the payoff of clean lead sources and loss reasons shows up right here.